Data Visualization with Power BI and Tableau

Teacher
Prof. Dr. Basheer Ahmad SamimLast Update
06-December-2025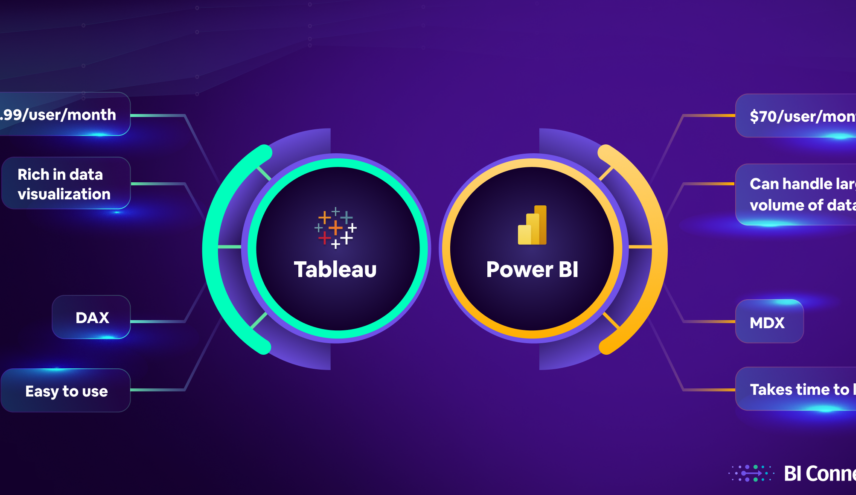
- Discription
Course Overview
A practical course designed to teach students how to convert raw data into visually compelling dashboards using Power BI and Tableau. Ideal for aspiring analysts and business professionals.
Requirements
Before enrolling, ensure you meet the basic prerequisites. These may include foundational knowledge, necessary tools, or specific skills required to fully benefit from the course. Check the list of requirements to make sure you're prepared for a smooth learning experience!
- Basic Excel skills
- familiarity with data structures
Description
Students will learn how to connect datasets, build charts, and create interactive dashboards in both Power BI and Tableau. This course includes real-world business scenarios to teach how data visualization aids decision-making. It covers visual best practices, calculated fields, filters, slicers, and publishing dashboards to the web. Each student will complete a final visualization project to showcase their skills. Practical labs ensure hands-on experience with each tool.
Related Courses

Prof. Dr. Basheer Ahmad Samim


Mr. Asif Mahmood Jasra

Mr. Asif Mahmood Jasra

Machine Learning A-Z: Hands-On Python & R In Data Science
Category: AI & Machine Learning
Deep Learning Specialization
Category: AI & Machine Learning